EasyLLMOps
EasyLLMOps: Effortless MLOps for Powerful Language Models.
Introduction
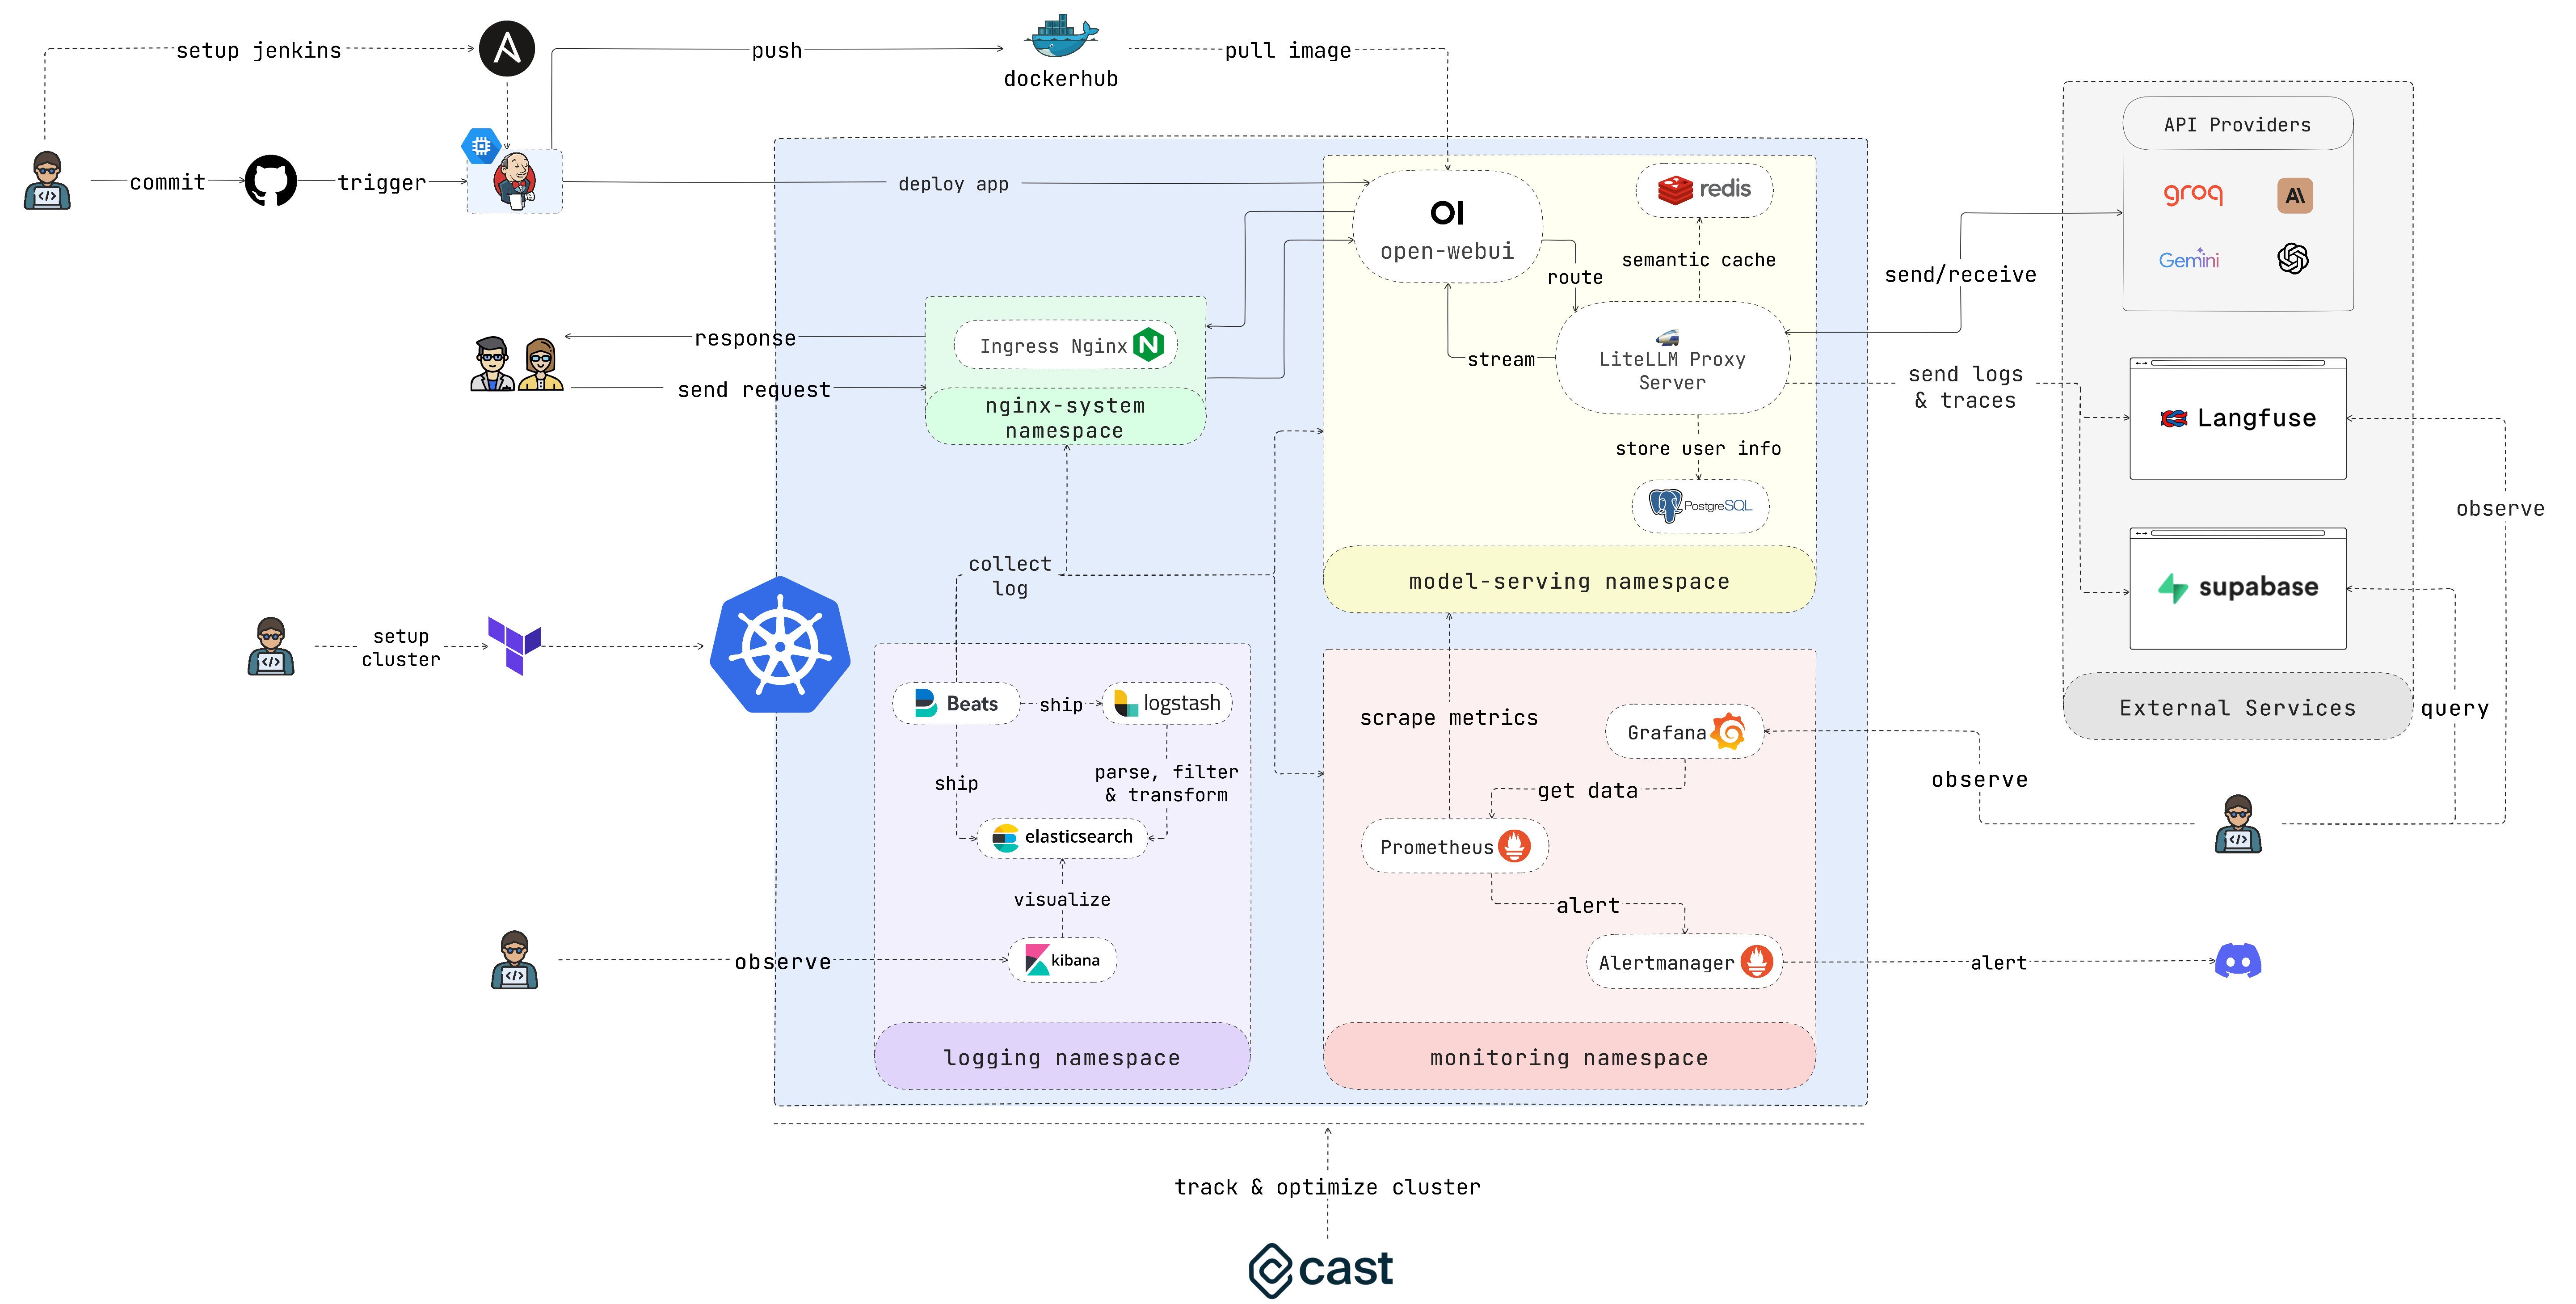
EasyLLMOps is a project built with Open WebUI that can be deployed on Google Kubernetes Engine (GKE) for managing and scaling language models. It offers both Terraform and manual deployment methods, and incorporates robust MLOps practices. This includes CI/CD pipelines with Jenkins and Ansible for automation, monitoring with Prometheus and Grafana for performance insights, and centralized logging with the ELK stack for troubleshooting and analysis. Developers can find detailed documentation and instructions on the project’s website.
https://github.com/user-attachments/assets/cf84a434-0dae-47b9-a93d-49a37965d968
Features
- Ease of Use: EasyLLMOps provides an intuitive interface and streamlined workflows that make managing LLMs simple and efficient, regardless of your experience level.
- Scalability & Flexibility: Scale your LLM deployments effortlessly, adapt to evolving needs, and integrate seamlessly with your existing infrastructure.
- Reduced Complexity: Eliminate the hassle of complex configurations and infrastructure management, allowing you to focus on building and deploying powerful LLM applications.
- Enhanced Productivity: Accelerate your LLM development lifecycle, optimize performance, and maximize the impact of your language models.
Target Audience
Developers building and deploying LLM-powered applications. Data scientists and machine learning engineers working with LLMs. DevOps teams responsible for managing LLM infrastructure. Organizations looking to integrate LLMs into their operations.
Table of Contents
- Introduction
- Features
- Target Audience
- Getting Started
- Quick Start
- Using Terraform for Google Kubernetes Engine (GKE)
- Manual Deployment to GKE
- Continuous Integration/Continuous Deployment (CI/CD) with Jenkins and Ansible
- Monitoring with Prometheus and Grafana
- Logging with Filebeat + Logstash + Elasticsearch + Kibana
- Optimize Cluster with Cast AI
- Log and Trace with Langfuse and Supabase
- Contributing
- License
- Citation
- Contact
Getting Started
In case you don’t want to spend much time, please run this script and enjoy your coffee:
chmod +x ./cluster.sh
./cluster.sh
Remember to authenticate with GCP before using Terraform:
gcloud auth application-default login
Quick Start
This section provides a very quick start guide to get the application up and running as soon as possible. Please refer to the following sections for more detailed instructions.
Using Terraform for Google Kubernetes Engine (GKE)
If you’re deploying the application to GKE, you can use Terraform to automate the setup of your Kubernetes cluster. Navigate to the iac/terraform directory and initialize Terraform:
cd iac/terraform
terraform init
Plan and Apply Configuration:
Generate an execution plan to verify the resources that Terraform will create or modify, and then apply the configuration to set up the cluster:
  terraform plan
  terraform apply
2. Retrieve Cluster Information:
To interact with your GKE cluster, you’ll need to retrieve its configuration. You can view the current cluster configuration with the following command:
cat ~/.kube/config
https://github.com/user-attachments/assets/3133c2a8-8475-45c6-8900-96c2af8c5ad5
Ensure your kubectl context is set correctly to manage the cluster.
Manual Deployment to GKE
For a more hands-on deployment process, follow these steps:
1. Deploy Nginx Ingress Controller:
The Nginx Ingress Controller manages external access to services in your Kubernetes cluster. Create a namespace and install the Ingress Controller using Helm:
kubectl create ns nginx-system
kubens nginx-system
helm upgrade --install nginx-ingress ./deployments/nginx-ingress
Please story the Nginx Ingress Controller’s IP address, as you’ll need it later.
https://github.com/user-attachments/assets/f329a8ee-cd4d-44e8-bb12-d1ff39dce4b8
Store your environment variables, such as API keys, securely in Kubernetes secrets. Create a namespace for model serving and create a secret from your .env file:
kubectl create ns model-serving
kubens model-serving
kubectl delete secret easyllmops-env
kubectl create secret generic easyllmops-env --from-env-file=.env -n model-serving
kubectl describe secret easyllmops-env -n model-serving
https://github.com/user-attachments/assets/fab6aa93-2f68-4f36-a4d8-4a1d955596f2
Kubernetes resources often require specific permissions. Apply the necessary roles and bindings:
cd deployments/infrastructure
kubectl apply -f role.yaml
kubectl apply -f rolebinding.yaml
https://github.com/user-attachments/assets/9c1aa6e1-6b8c-4332-ab11-513428ef763b
4. Deploy caching service using Redis:
Now, deploy the semantic caching service using Redis:
cd ./deployments/redis
helm dependency build
helm upgrade --install redis .
https://github.com/user-attachments/assets/ef37626a-9a98-473e-a7e0-effcaa262ad5
Deploy the LiteLLM service:
kubens model-serving
helm upgrade --install litellm ./deployments/litellm
https://github.com/user-attachments/assets/0c98fe90-f958-42fc-9fa6-224dcf417e29
Next, Deploy the web UI to your GKE cluster:
cd open-webui
kubectl apply -f ./kubernetes/manifest/base -n model-serving
https://github.com/user-attachments/assets/60ad30e3-e8f8-49a6-ab96-d895fe7986cb
7. Play around with the Application:
Open browser and navigate to the URL of your GKE cluster (e.g. http://172.0.0.0 in step 1) and add .nip.io to the end of the URL (e.g. http://172.0.0.0.nip.io). You should see the Open WebUI:
https://github.com/user-attachments/assets/4115a1f0-e513-4c58-a359-1d49683905a8
Continuous Integration/Continuous Deployment (CI/CD) with Jenkins and Ansible
For automated CI/CD pipelines, use Jenkins and Ansible as follows:
First, create a Service Account and assign it the Compute Admin role. Then create a Json key file for the Service Account and store it in the iac/ansible/secrets directory.
Next create a Google Compute Engine instance named “jenkins-server” running Ubuntu 22.04 with a firewall rule allowing traffic on ports 8081 and 50000.
ansible-playbook iac/ansible/deploy_jenkins/create_compute_instance.yaml
Deploy Jenkins on a server by installing prerequisites, pulling a Docker image, and creating a privileged container with access to the Docker socket and exposed ports 8081 and 50000.
ansible-playbook -i iac/ansible/inventory iac/ansible/deploy_jenkins/deploy_jenkins.yaml
https://github.com/user-attachments/assets/35dae326-aa8f-4779-bf67-2b8d9f71487b
To access the Jenkins server through SSH, we need to create a public/private key pair. Run the following command to create a key pair:
ssh-keygen
Open Metadata and copy the ssh-keys value.
https://github.com/user-attachments/assets/8fd956be-d2db-4d85-aa7c-f78df160c00c
We need to find the Jenkins server password to be able to access the server. First, access the Jenkins server:
ssh <USERNAME>:<EXTERNAL_IP>
Then run the following command to get the password:
sudo docker exec -it jenkins-server bash
cat /var/jenkins_home/secrets/initialAdminPassword
https://github.com/user-attachments/assets/08cb4183-a383-4dd2-89e3-da6e74b92d04
Once Jenkins is deployed, access it via your browser:
http://<EXTERNAL_IP>:8081
https://github.com/user-attachments/assets/4f0d3287-39ec-40e7-b333-9287ee37f9fc
Install the following plugins to integrate Jenkins with Docker, Kubernetes, and GKE:
- Docker
- Docker Pipeline
- Kubernetes
- Google Kubernetes Engine
After installing the plugins, restart Jenkins.
sudo docker restart jenkins-server
https://github.com/user-attachments/assets/923f7aff-3983-4b3d-8ef5-17d2285aed63
4.1. Add webhooks to your GitHub repository to trigger Jenkins builds.
Go to the GitHub repository and click on Settings. Click on Webhooks and then click on Add Webhook. Enter the URL of your Jenkins server (e.g. http://<EXTERNAL_IP>:8081/github-webhook/). Then click on Let me select individual events and select Let me select individual events. Select Push and Pull Request and click on Add Webhook.
https://github.com/user-attachments/assets/d6ec020a-3e93-4ce8-bf80-b9f63b227635
4.2. Add Github repository as a Jenkins source code repository.
Go to Jenkins dashboard and click on New Item. Enter a name for your project (e.g. easy-llmops) and select Multibranch Pipeline. Click on OK. Click on Configure and then click on Add Source. Select GitHub and click on Add. Enter the URL of your GitHub repository (e.g. https://github.com/bmd1905/EasyLLMOps). In the Credentials field, select Add and select Username with password. Enter your GitHub username and password (or use a personal access token). Click on Test Connection and then click on Save.
https://github.com/user-attachments/assets/57c97866-caf3-4864-92c9-b91863822591
4.3. Setup docker hub credentials.
First, create a Docker Hub account. Go to the Docker Hub website and click on Sign Up. Enter your username and password. Click on Sign Up. Click on Create Repository. Enter a name for your repository (e.g. easy-llmops) and click on Create.
From Jenkins dashboard, go to Manage Jenkins > Credentials. Click on Add Credentials. Select Username with password and click on Add. Enter your Docker Hub username, access token, and set ID to dockerhub.
https://github.com/user-attachments/assets/3df2f7e2-d284-4da9-82fb-cc65ebb6240b
4.4. Setup Kubernetes credentials.
First, create a Service Account for the Jenkins server to access the GKE cluster. Go to the GCP console and navigate to IAM & Admin > Service Accounts. Create a new service account with the Kubernetes Engine Admin role. Give the service account a name and description. Click on the service account and then click on the Keys tab. Click on Add Key and select JSON as the key type. Click on Create and download the JSON file.
https://github.com/user-attachments/assets/d294a5a3-8a3d-4271-b20c-3ebf237f4005
Then, from Jenkins dashboard, go to Manage Jenkins > Cloud. Click on New cloud. Select Kubernetes. Enter the name of your cluster (e.g. gke-easy-llmops-cluster-1), enter the URL and Certificate from your GKE cluster. In the Kubernetes Namespace, enter the namespace of your cluster (e.g. model-serving). In the Credentials field, select Add and select Google Service Account from private`. Enter your project-id and the path to the JSON file.
https://github.com/user-attachments/assets/489ce405-a31f-4f56-94bb-faebe1edd849
Push a new commit to your GitHub repository. You should see a new build in Jenkins.
https://github.com/user-attachments/assets/7f4d9286-b41f-4218-a970-fd45c8ecd01c
Monitoring with Prometheus and Grafana
First, create a Discord webhook. Go to the Discord website and click on Server Settings. Click on Integrations. Click on Create Webhook. Enter a name for your webhook (e.g. easy-llmops-discord-webhook) and click on Create. Copy the webhook URL.
https://github.com/user-attachments/assets/2f1258f0-b3c7-4b3b-8cc4-802034600a82
2. Configure Helm Repositories
First, we need to add the necessary Helm repositories for Prometheus and Grafana:
helm repo add prometheus-community https://prometheus-community.github.io/helm-charts
helm repo add grafana https://grafana.github.io/helm-charts
helm repo update
These commands add the official Prometheus and Grafana Helm repositories and update your local Helm chart information.
Prometheus requires certain dependencies that can be managed with Helm. Navigate to the monitoring directory and build these dependencies:
helm dependency build ./deployments/monitoring/kube-prometheus-stack
Now, we’ll deploy Prometheus and its associated services using Helm:
kubectl create namespace monitoring
helm upgrade --install -f deployments/monitoring/kube-prometheus-stack.expanded.yaml kube-prometheus-stack deployments/monitoring/kube-prometheus-stack -n monitoring
This command does the following:
helm upgrade --install: This will install Prometheus if it doesn’t exist, or upgrade it if it does.-f deployments/monitoring/kube-prometheus-stack.expanded.yaml: This specifies a custom values file for configuration.kube-prometheus-stack: This is the release name for the Helm installation.deployments/monitoring/kube-prometheus-stack: This is the chart to use for installation.-n monitoring: This specifies the namespace to install into.
https://github.com/user-attachments/assets/6828527c-9561-42bc-a221-fbbaf9097233
By default, the services are not exposed externally. To access them, you can use port-forwarding:
For Prometheus:
kubectl port-forward -n monitoring svc/kube-prometheus-stack-prometheus 9090:9090
Then access Prometheus at http://localhost:9090
For Grafana:
kubectl port-forward -n monitoring svc/kube-prometheus-stack-grafana 3000:80
Then access Grafana at http://localhost:3000
The default credentials for Grafana are usually:
- Username: admin
- Password: prom-operator (you should change this immediately)
https://github.com/user-attachments/assets/a9a2e7f7-0a88-4e21-ba63-7a3f993d1c78
First we need to create a sample alert. Navigate to the monitoring directory and run the following command:
kubectl port-forward -n monitoring svc/alertmanager-operated 9093:9093
Then, in a new terminal, run the following command:
curl -XPOST -H "Content-Type: application/json" -d '[
  {
    "labels": {
      "alertname": "DiskSpaceLow",
      "severity": "critical",
      "instance": "server02",
      "job": "node_exporter",
      "mountpoint": "/data"
    },
    "annotations": {
      "summary": "Disk space critically low",
      "description": "Server02 has only 5% free disk space on /data volume"
    },
    "startsAt": "2023-09-01T12:00:00Z",
    "generatorURL": "http://prometheus.example.com/graph?g0.expr=node_filesystem_free_bytes+%2F+node_filesystem_size_bytes+%2A+100+%3C+5"
  },
  {
    "labels": {
      "alertname": "HighMemoryUsage",
      "severity": "warning",
      "instance": "server03",
      "job": "node_exporter"
    },
    "annotations": {
      "summary": "High memory usage detected",
      "description": "Server03 is using over 90% of its available memory"
    },
    "startsAt": "2023-09-01T12:05:00Z",
    "generatorURL": "http://prometheus.example.com/graph?g0.expr=node_memory_MemAvailable_bytes+%2F+node_memory_MemTotal_bytes+%2A+100+%3C+10"
  }
]' http://localhost:9093/api/v2/alerts
This command creates a sample alert. You can verify that the alert was created by running the following command:
curl http://localhost:9093/api/v2/status
Or, you can manually check the Discord channel.
https://github.com/user-attachments/assets/a5716e8c-ecd1-4457-80e9-27f23518bd1b
This setup provides comprehensive monitoring capabilities for your Kubernetes cluster. With Prometheus collecting metrics and Grafana visualizing them, you can effectively track performance, set up alerts for potential issues, and gain valuable insights into your infrastructure and applications.
Logging with Filebeat + Logstash + Elasticsearch + Kibana
Centralized logging is essential for monitoring and troubleshooting applications deployed on Kubernetes. This section guides you through setting up an ELK stack (Elasticsearch, Logstash, Kibana) with Filebeat for logging your GKE cluster.
You can use this single helmfile script to kick off the ELK stack:
cd deployments/ELK
helmfile sync
1. Install ELK Stack with Helm
We will use Helm to deploy the ELK stack components:
- Elasticsearch: Stores the logs.
- Logstash: Processes and filters the logs.
- Kibana: Provides a web UI for visualizing and searching logs.
- Filebeat: Collects logs from your pods and forwards them to Logstash.
First, create a namespace for the logging components:
kubectl create ns logging
kubens logging
Next, install Elasticsearch:
helm install elk-elasticsearch elastic/elasticsearch -f deployments/ELK/elastic.expanded.yaml --namespace logging --create-namespace
Wait for Elasticsearch to be ready:
echo "Waiting for Elasticsearch to be ready..."
kubectl wait --for=condition=ready pod -l app=elasticsearch-master --timeout=300s
Create a secret for Logstash to access Elasticsearch:
kubectl create secret generic logstash-elasticsearch-credentials \
  --from-literal=username=elastic \
  --from-literal=password=$(kubectl get secrets --namespace=logging elasticsearch-master-credentials -ojsonpath='{.data.password}' | base64 -d)
Install Kibana:
helm install elk-kibana elastic/kibana -f deployments/ELK/kibana.expanded.yaml
Install Logstash:
helm install elk-logstash elastic/logstash -f deployments/ELK/logstash.expanded.yaml
Install Filebeat:
helm install elk-filebeat elastic/filebeat -f deployments/ELK/filebeat.expanded.yaml
https://github.com/user-attachments/assets/75dbde44-6ce4-432d-9851-143e13a60fce
Expose Kibana using a service and access it through your browser:
kubectl port-forward -n logging svc/elk-kibana-kibana 5601:5601
Please use this script to get the Kibana password:
kubectl get secrets --namespace=logging elasticsearch-master-credentials -ojsonpath='{.data.password}' | base64 -d
Open your browser and navigate to http://localhost:5601.
You should now be able to see logs from your Kubernetes pods in Kibana. You can create dashboards and visualizations to analyze your logs and gain insights into your application’s behavior.
https://github.com/user-attachments/assets/a767e143-4fd2-406c-bf9f-9c5714b7404d
Optimize Cluster with Cast AI
Please go to Cast AI to sign up for a free account and get the TOKEN.
Then run this line to connect to GKE:
curl -H "Authorization: Token <TOKEN>" "https://api.cast.ai/v1/agent.yaml?provider=gke" | kubectl apply -f -
Hit I ran this script on Cast AI’s UI, then copy the configuration code and paste it into the terminal:
CASTAI_API_TOKEN=<API_TOKEN> CASTAI_CLUSTER_ID=<CASTAI_CLUSTER_ID> CLUSTER_NAME=easy-llmops-gke INSTALL_AUTOSCALER=true INSTALL_POD_PINNER=true INSTALL_SECURITY_AGENT=true LOCATION=asia-southeast1-b PROJECT_ID=easy-llmops /bin/bash -c "$(curl -fsSL 'https://api.cast.ai/v1/scripts/gke/onboarding.sh')"
Hit I ran this script again and waite for the installation to complete.
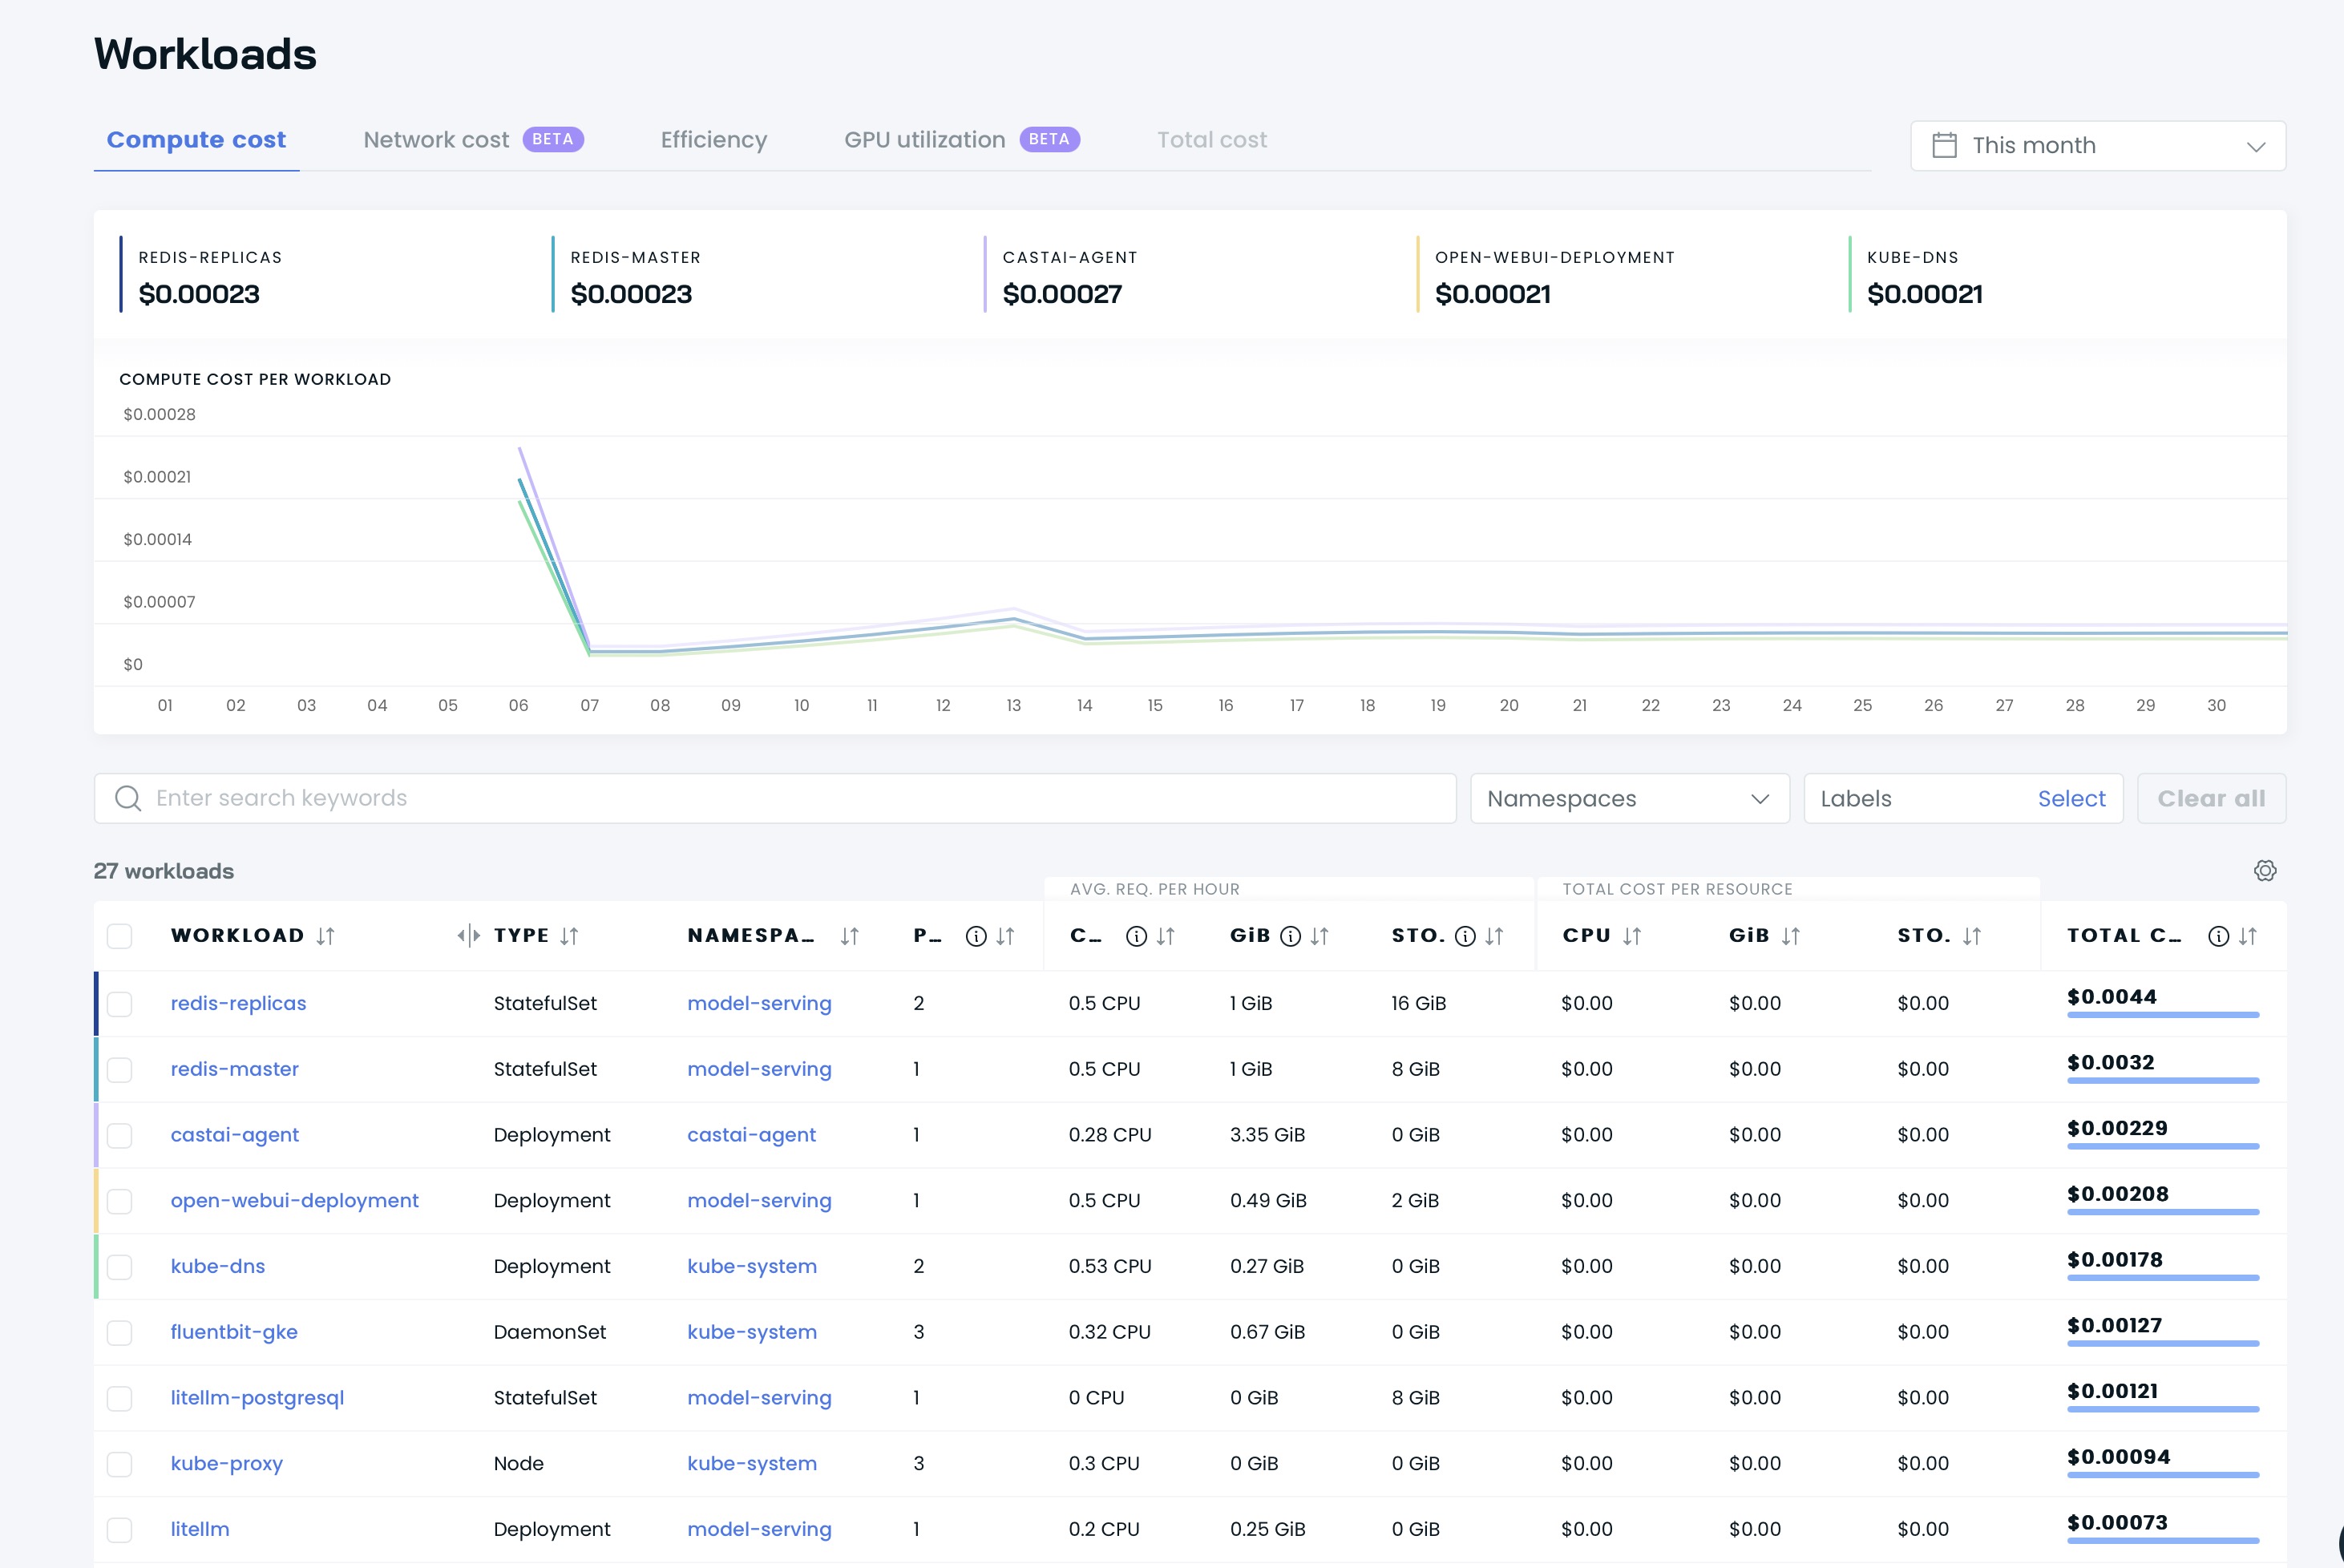
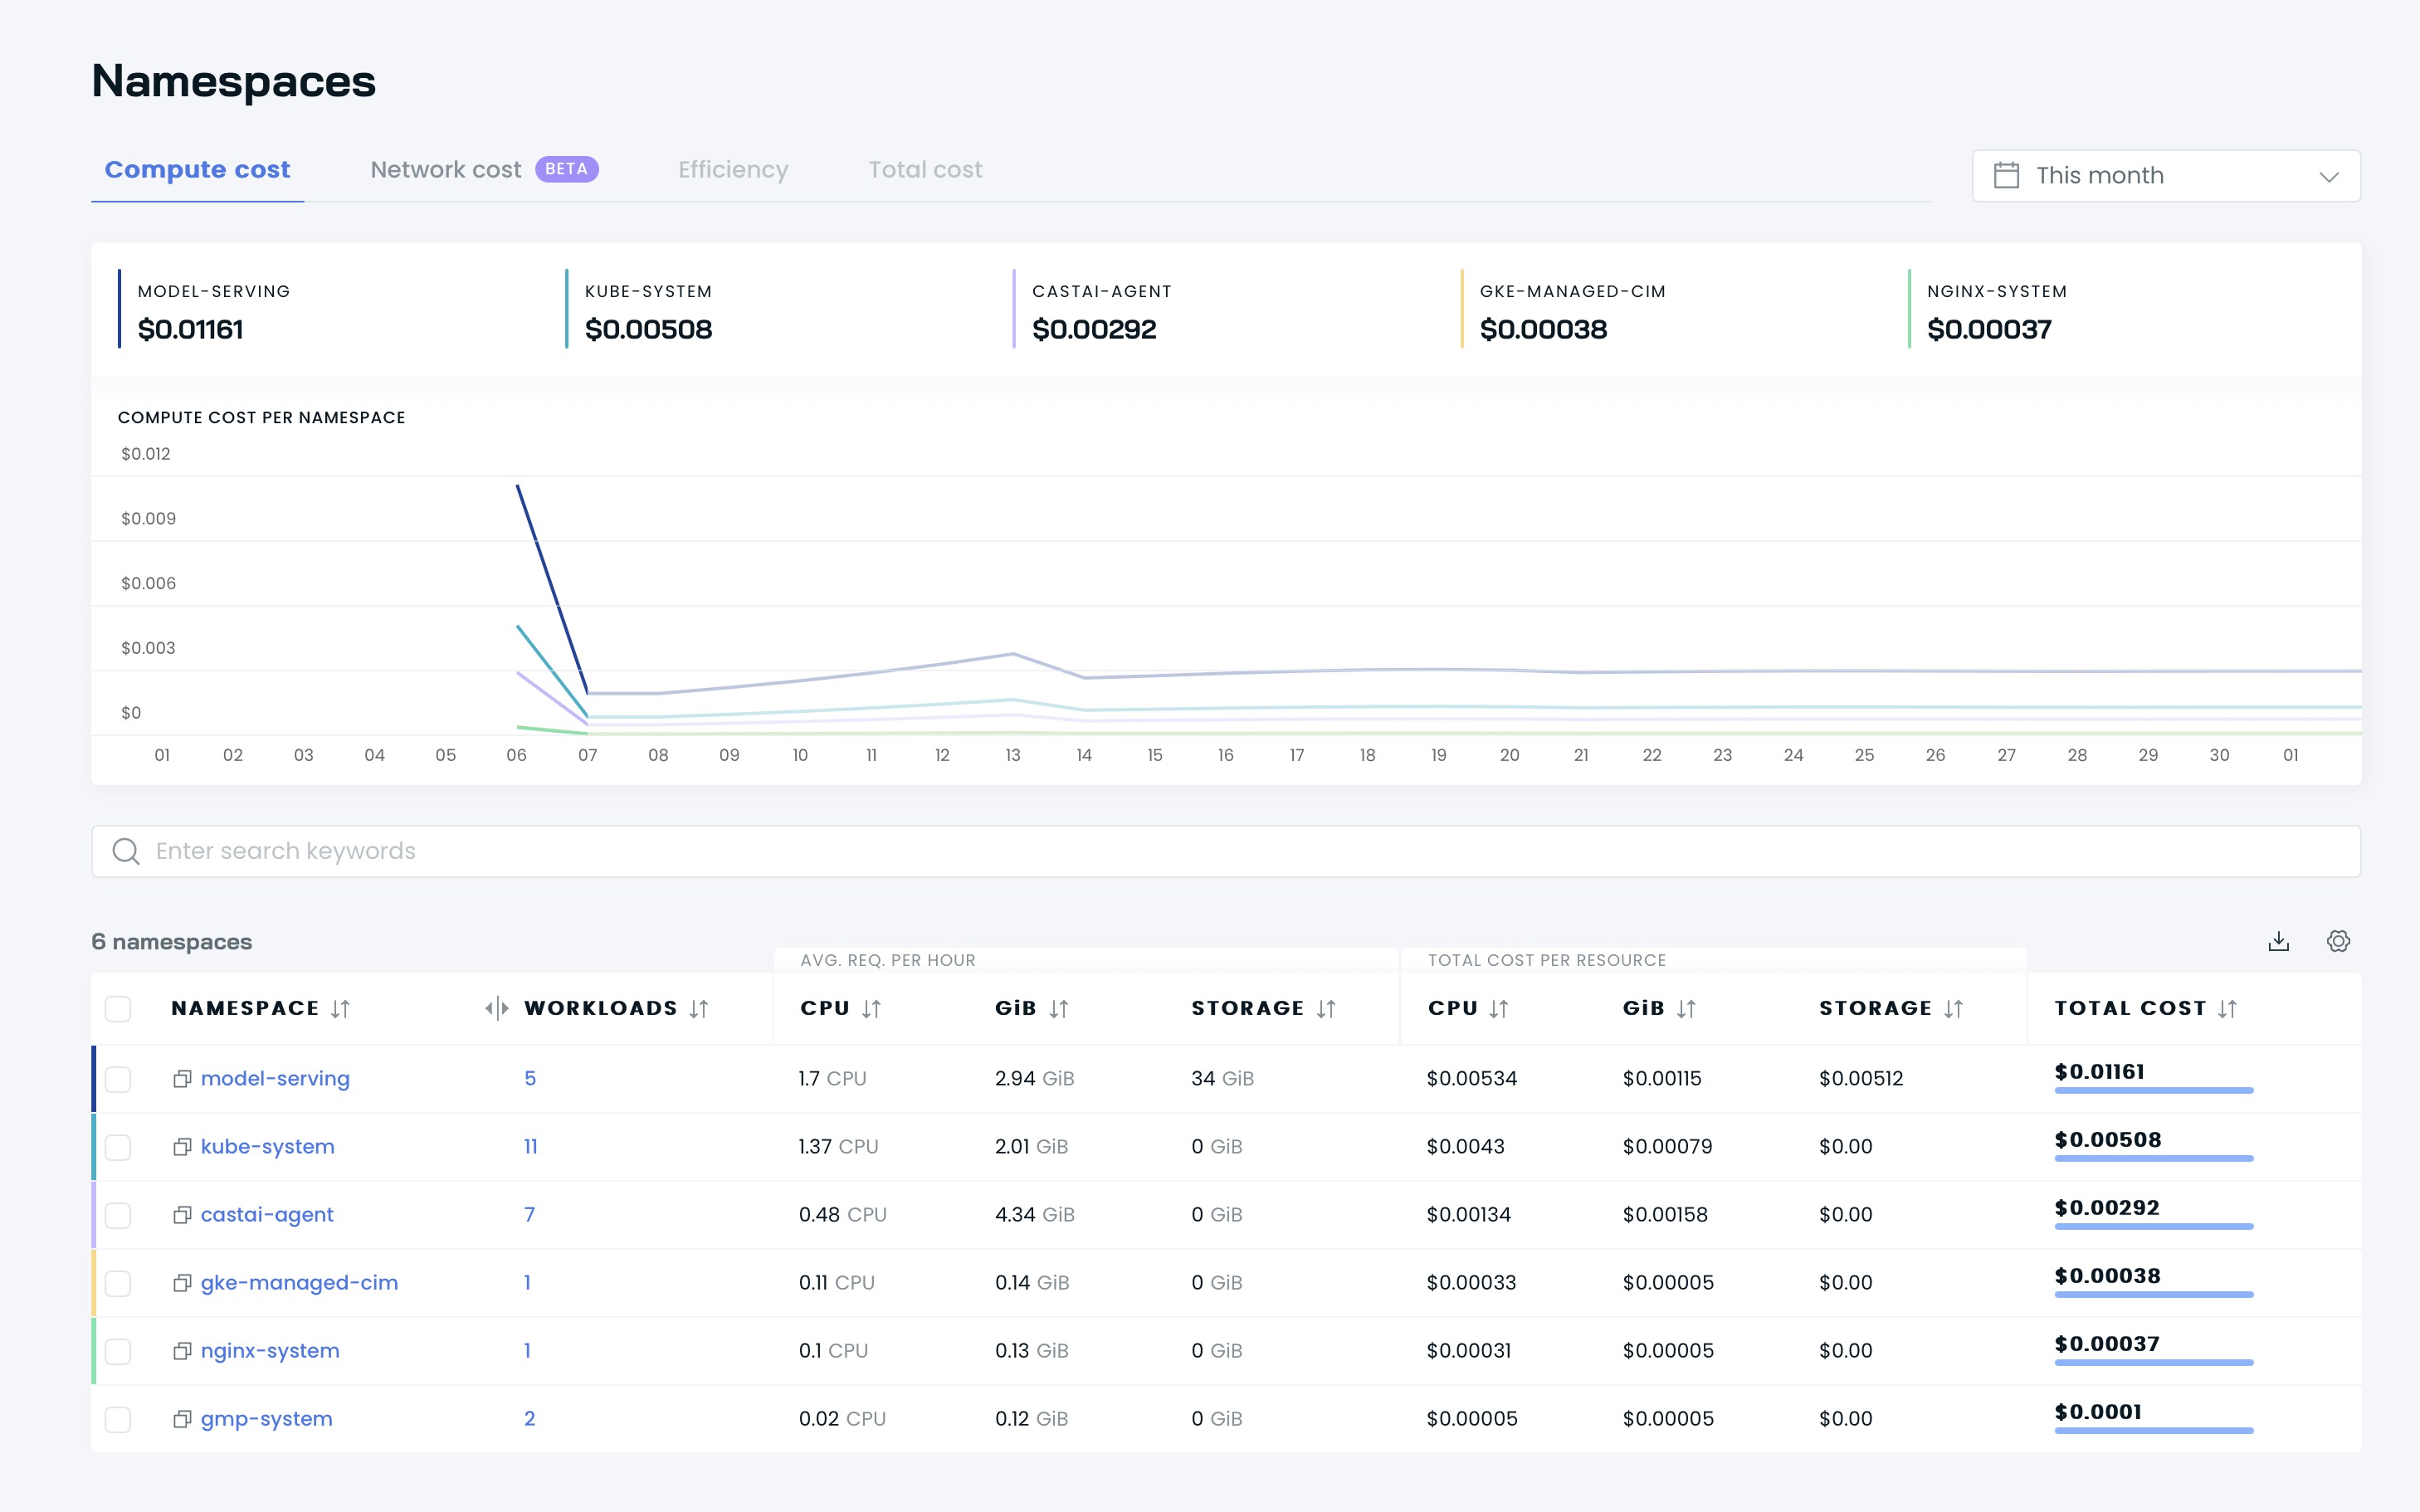
Then you can see your dashboards on Cast AI’s UI:
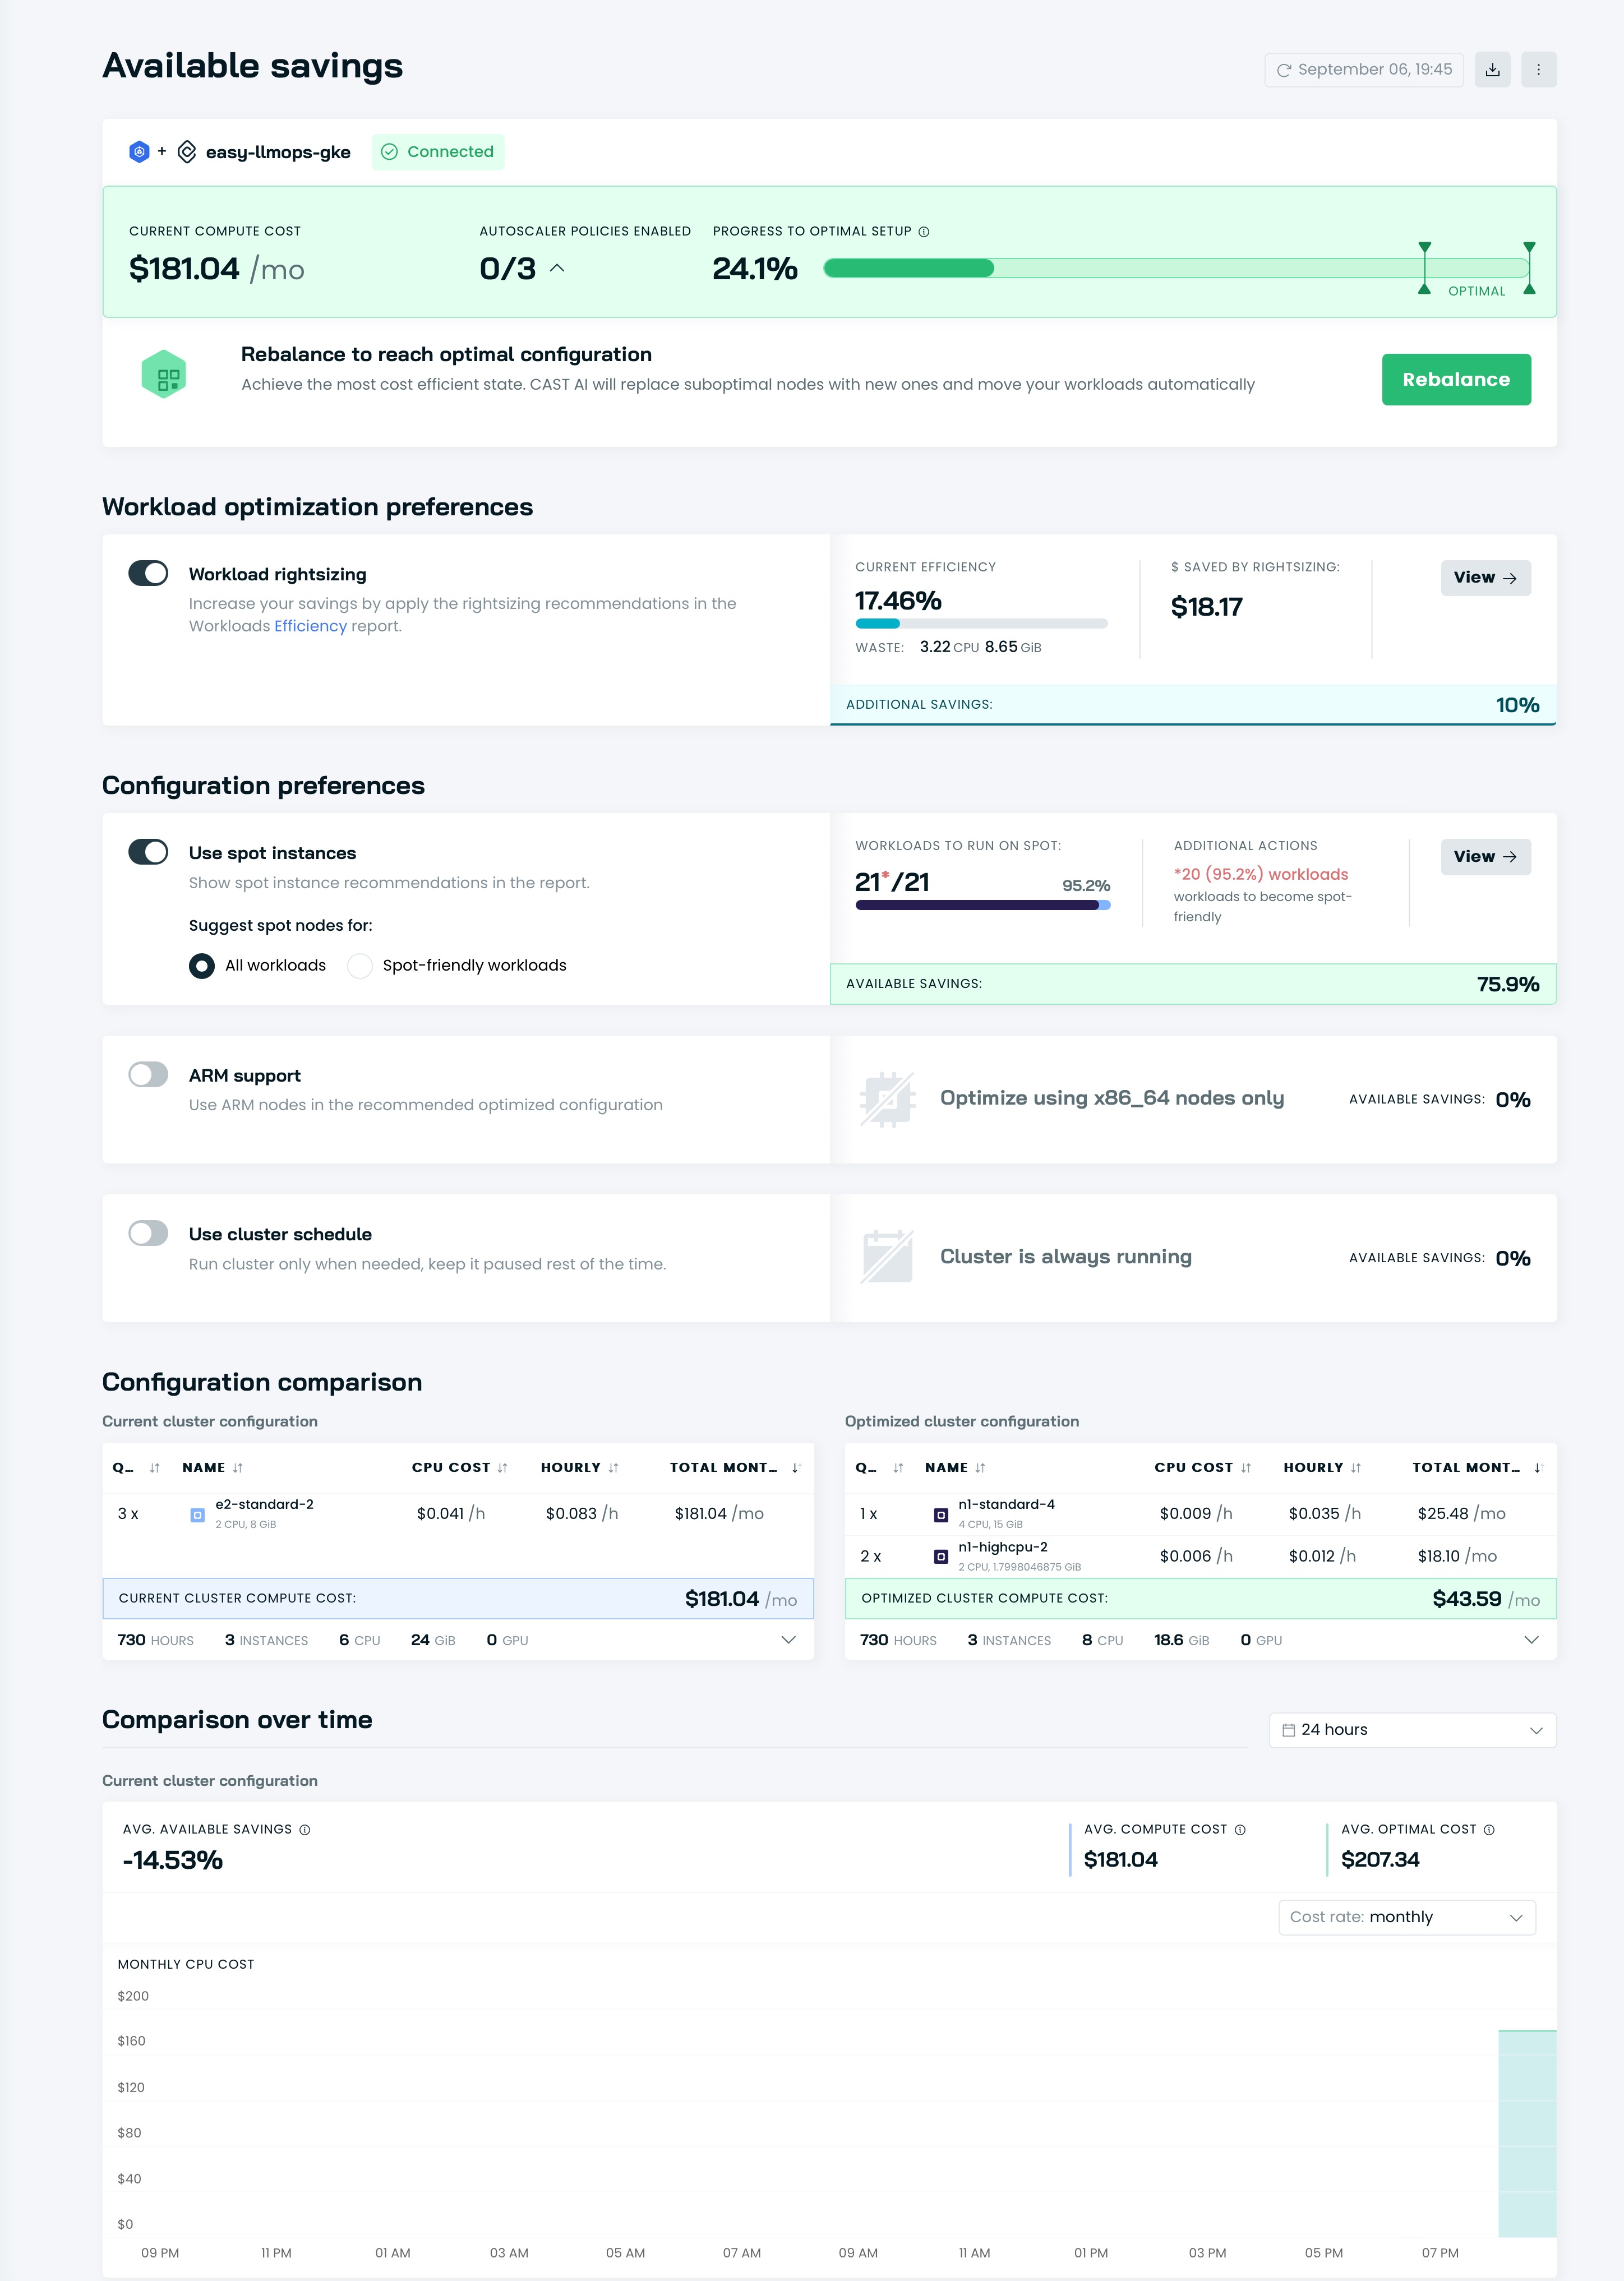
It’s time to optimize your cluster with Cast AI! Go go the Available savings seaction and click Rebalance button.
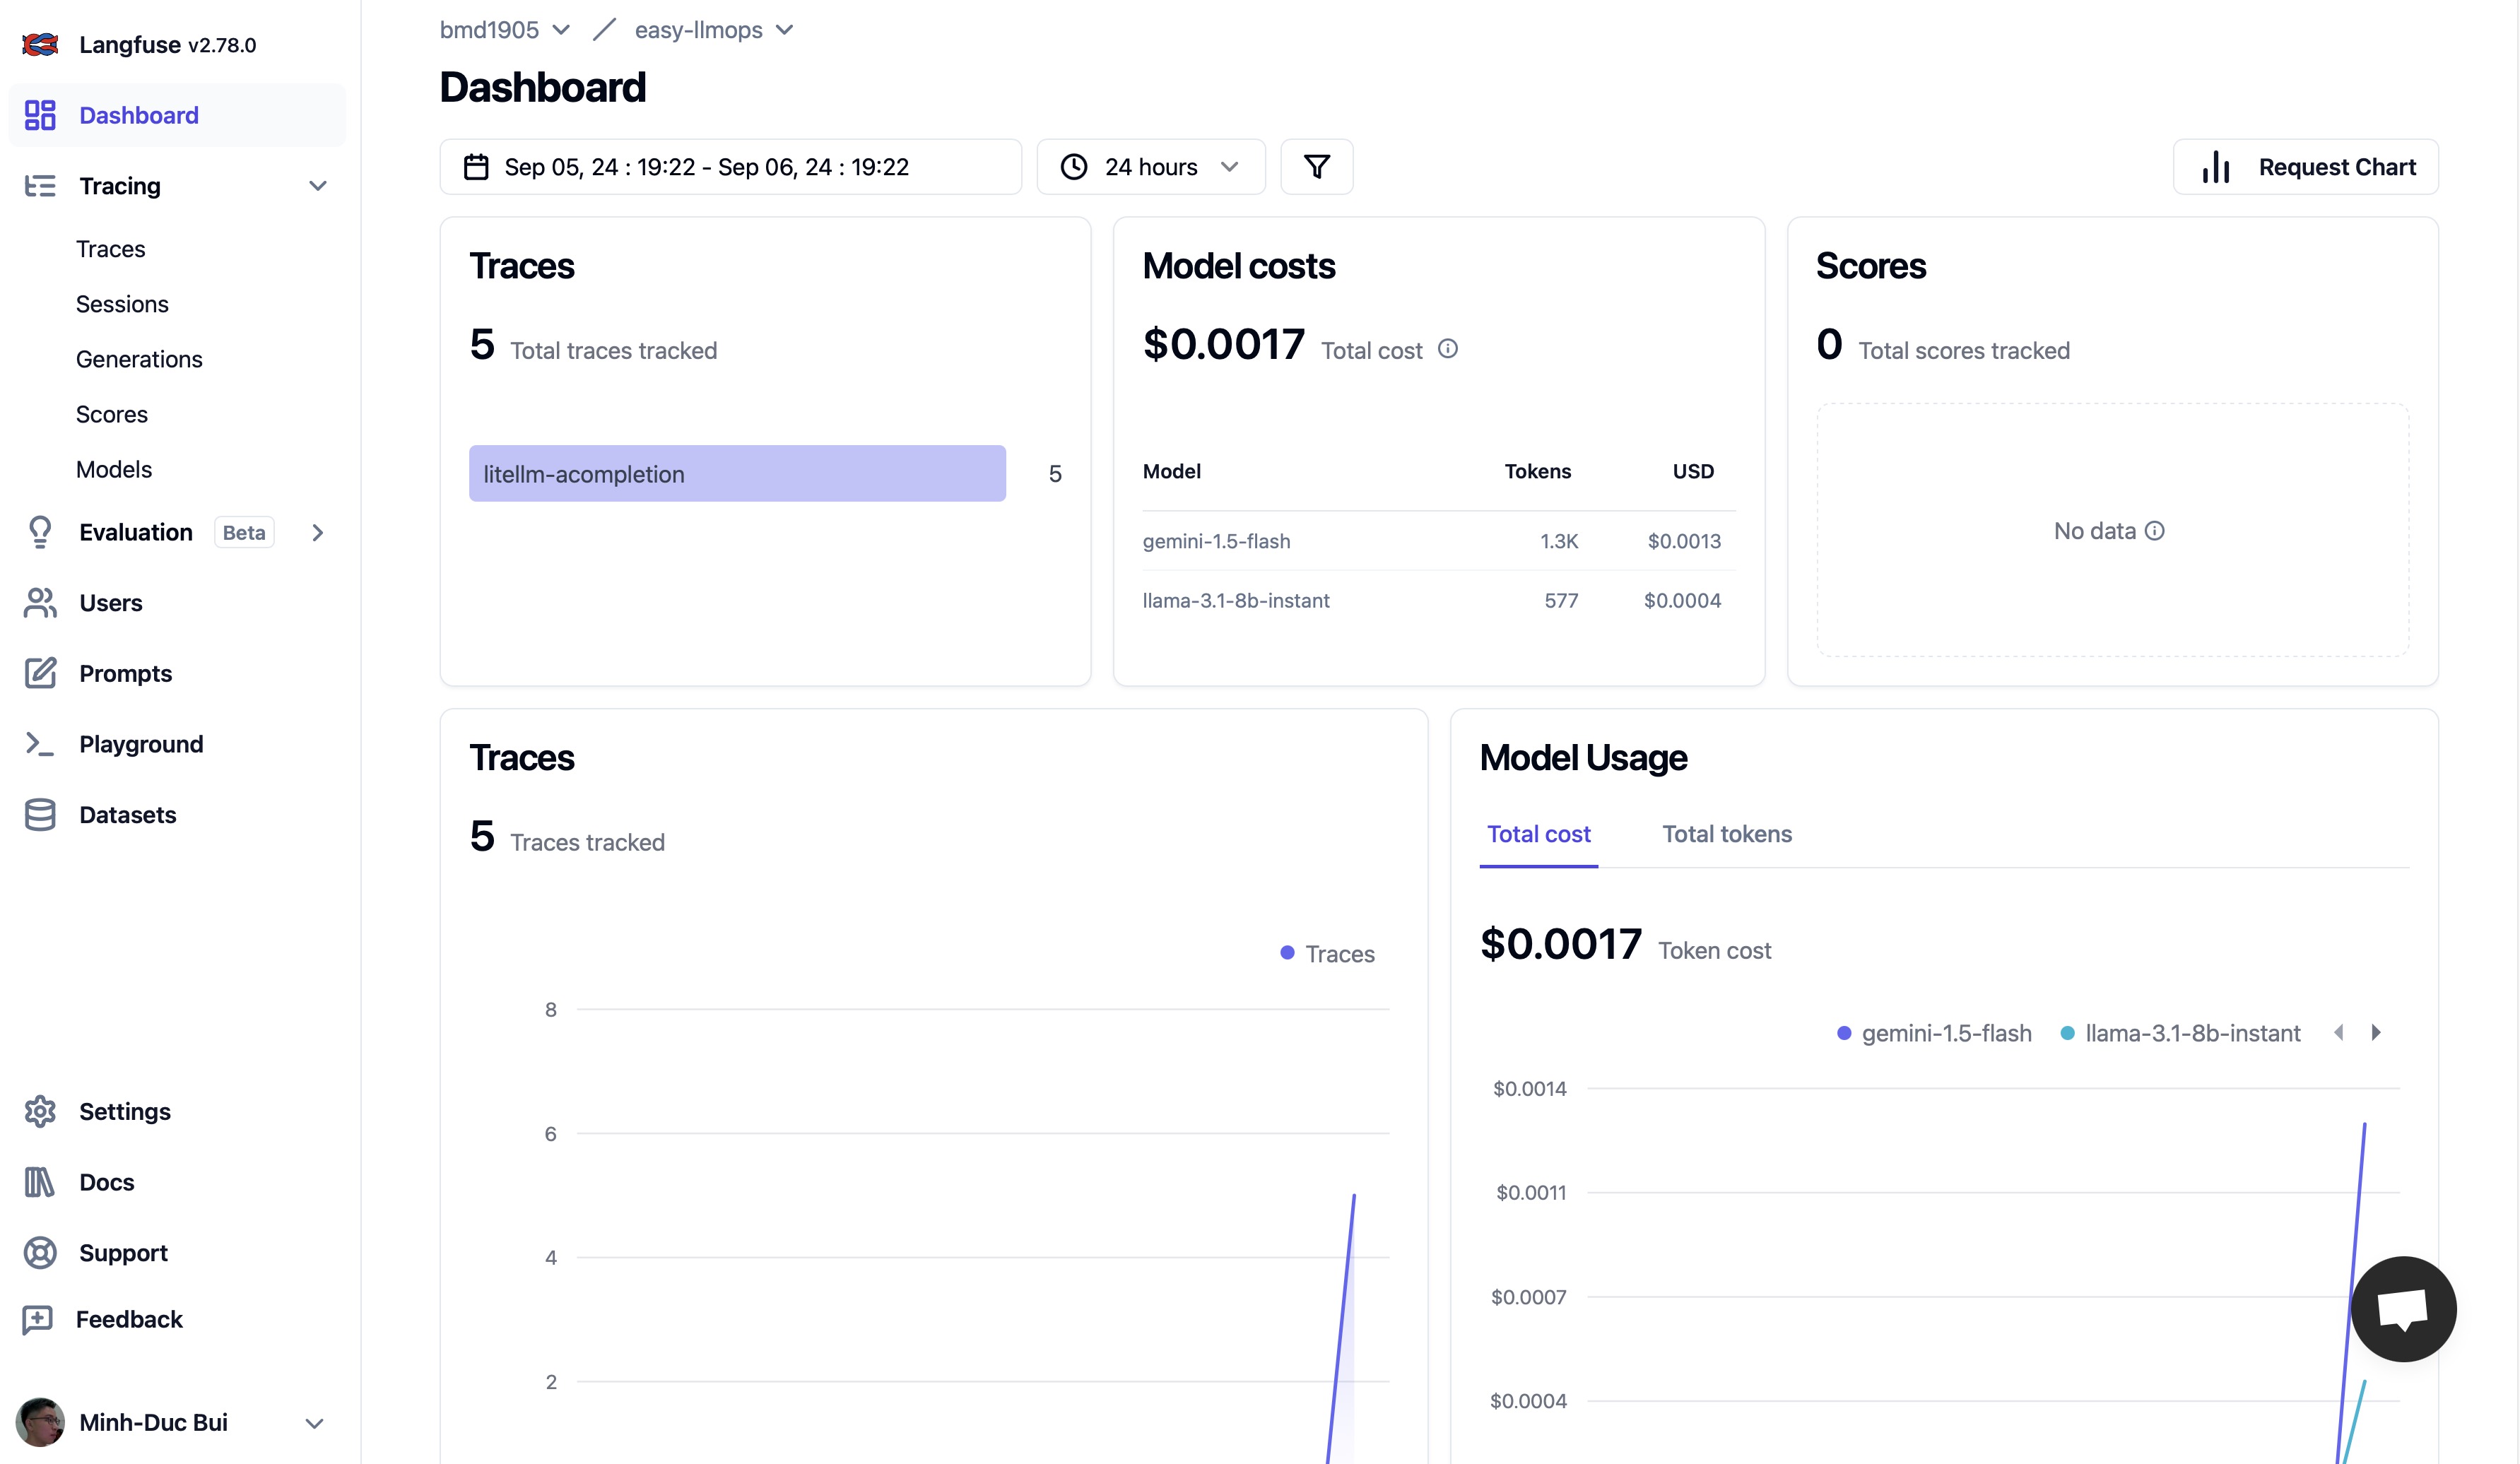
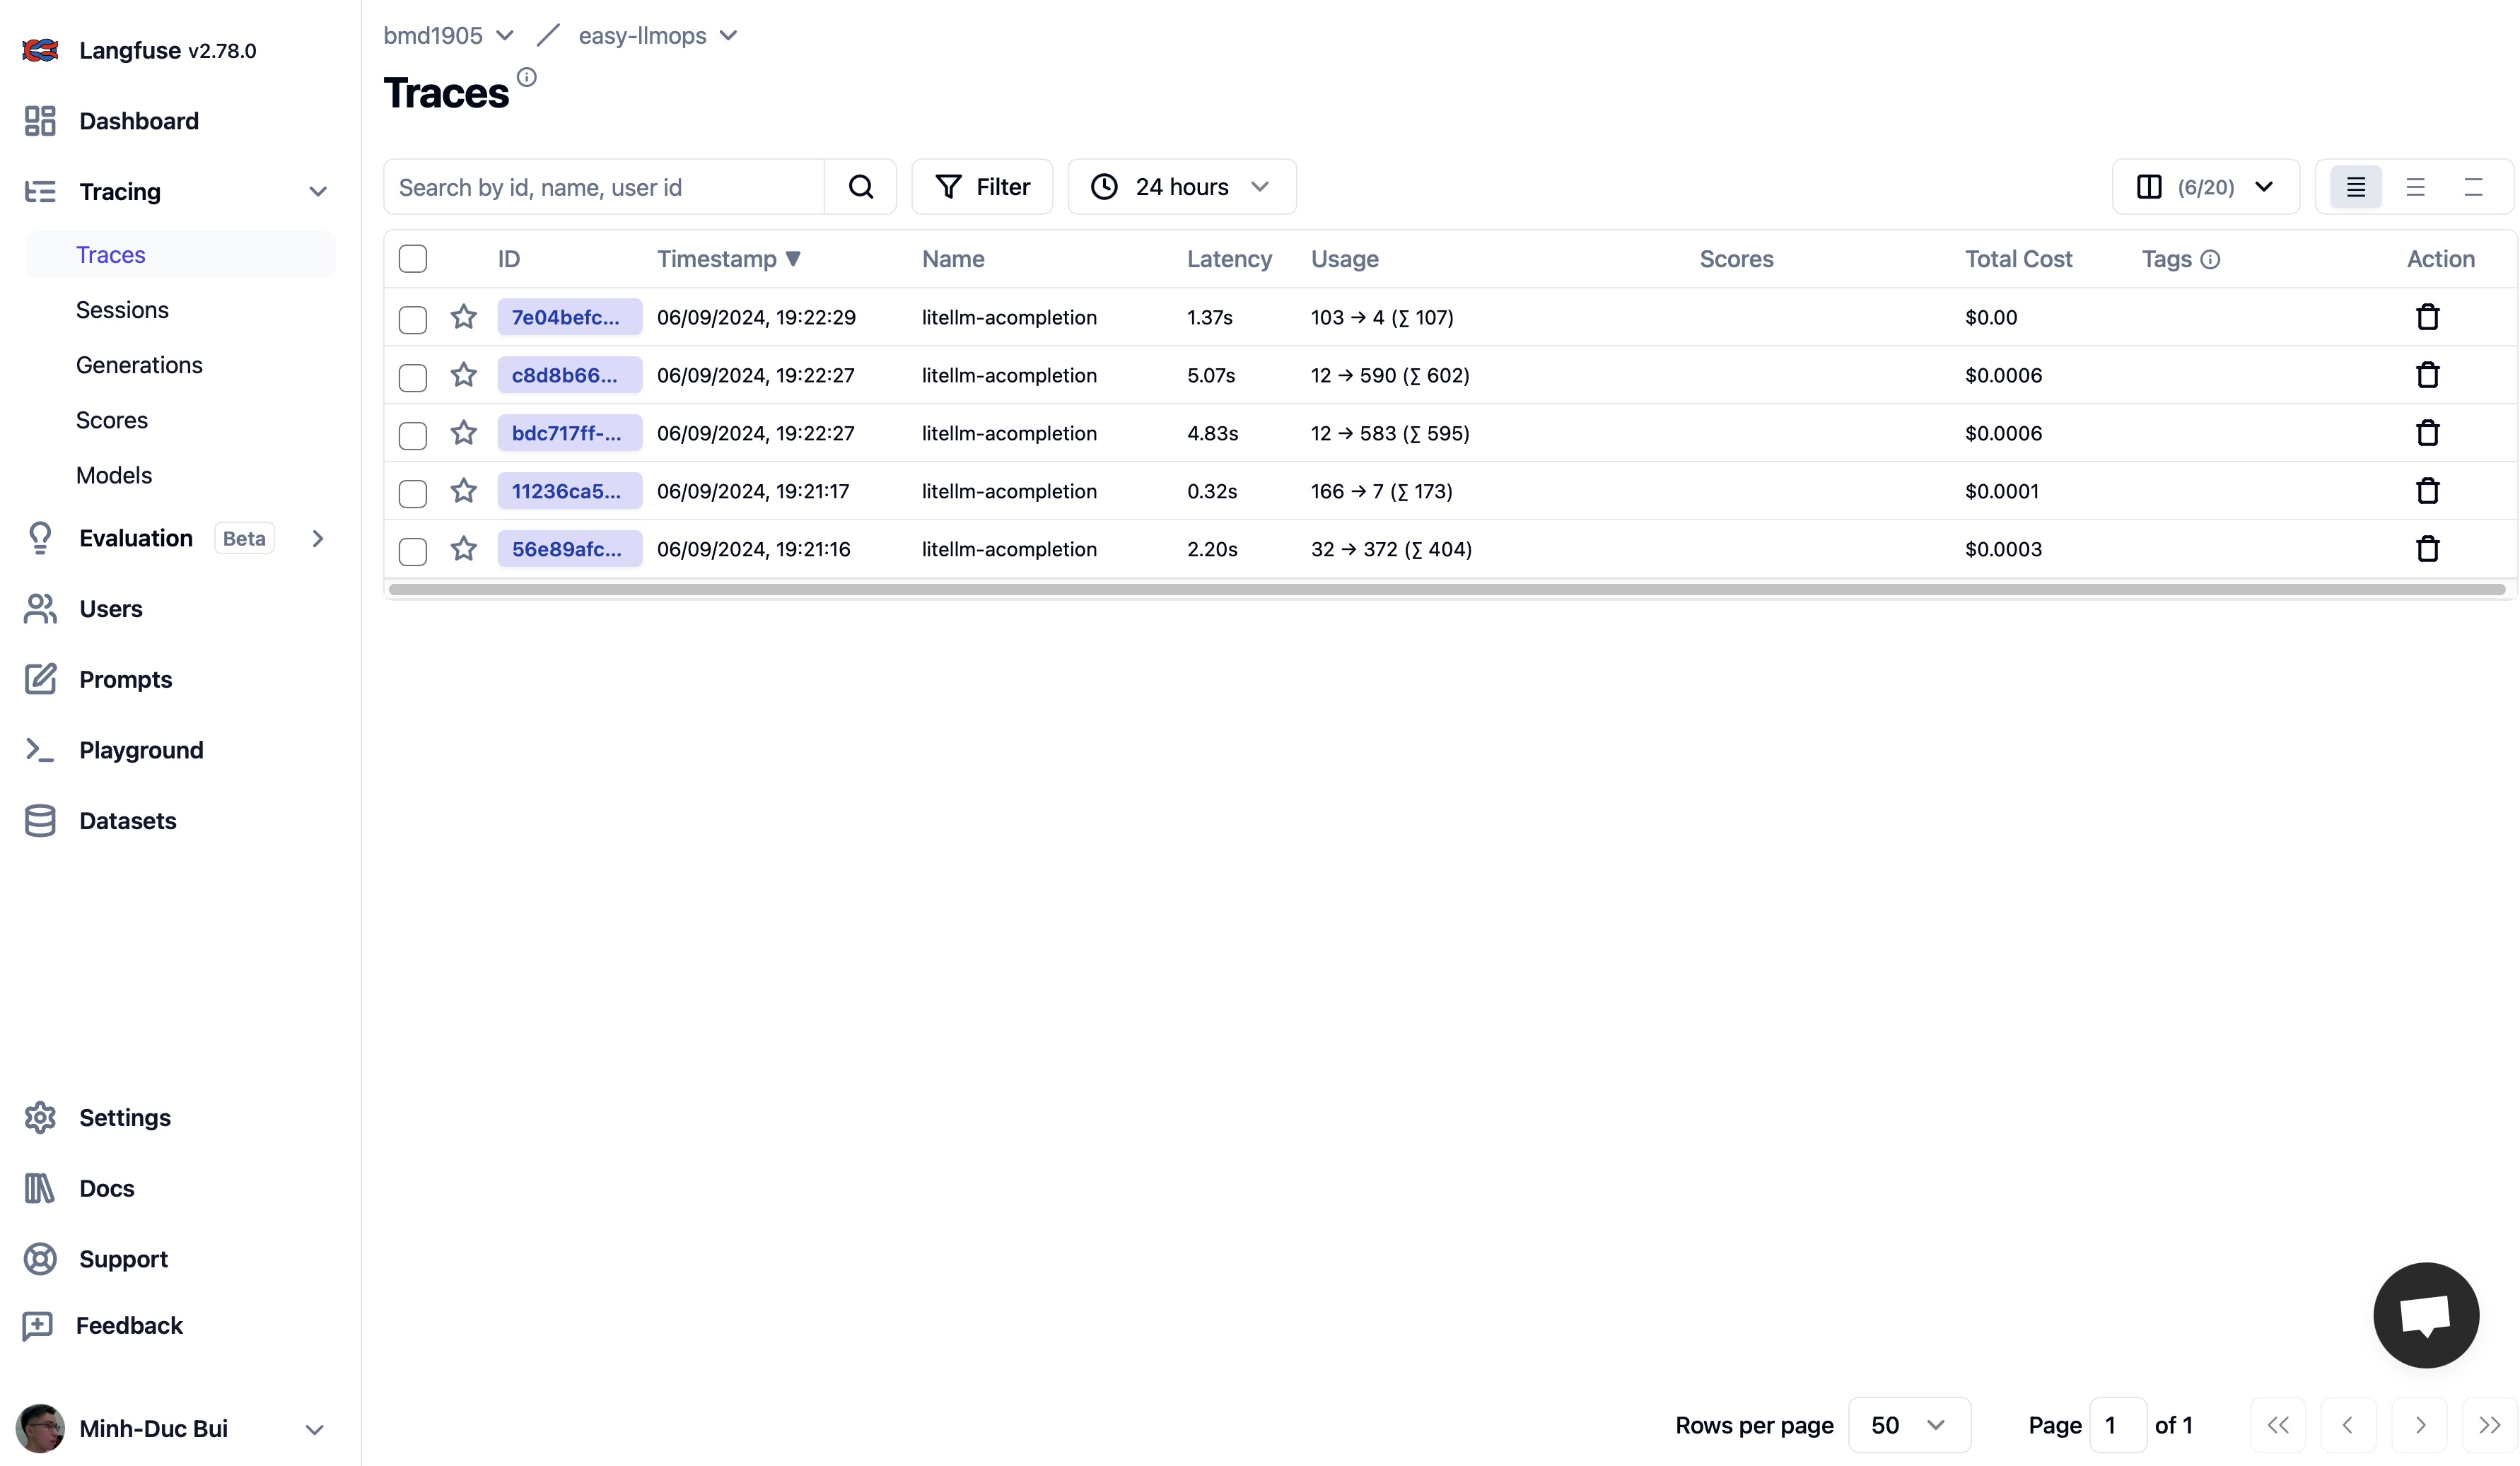
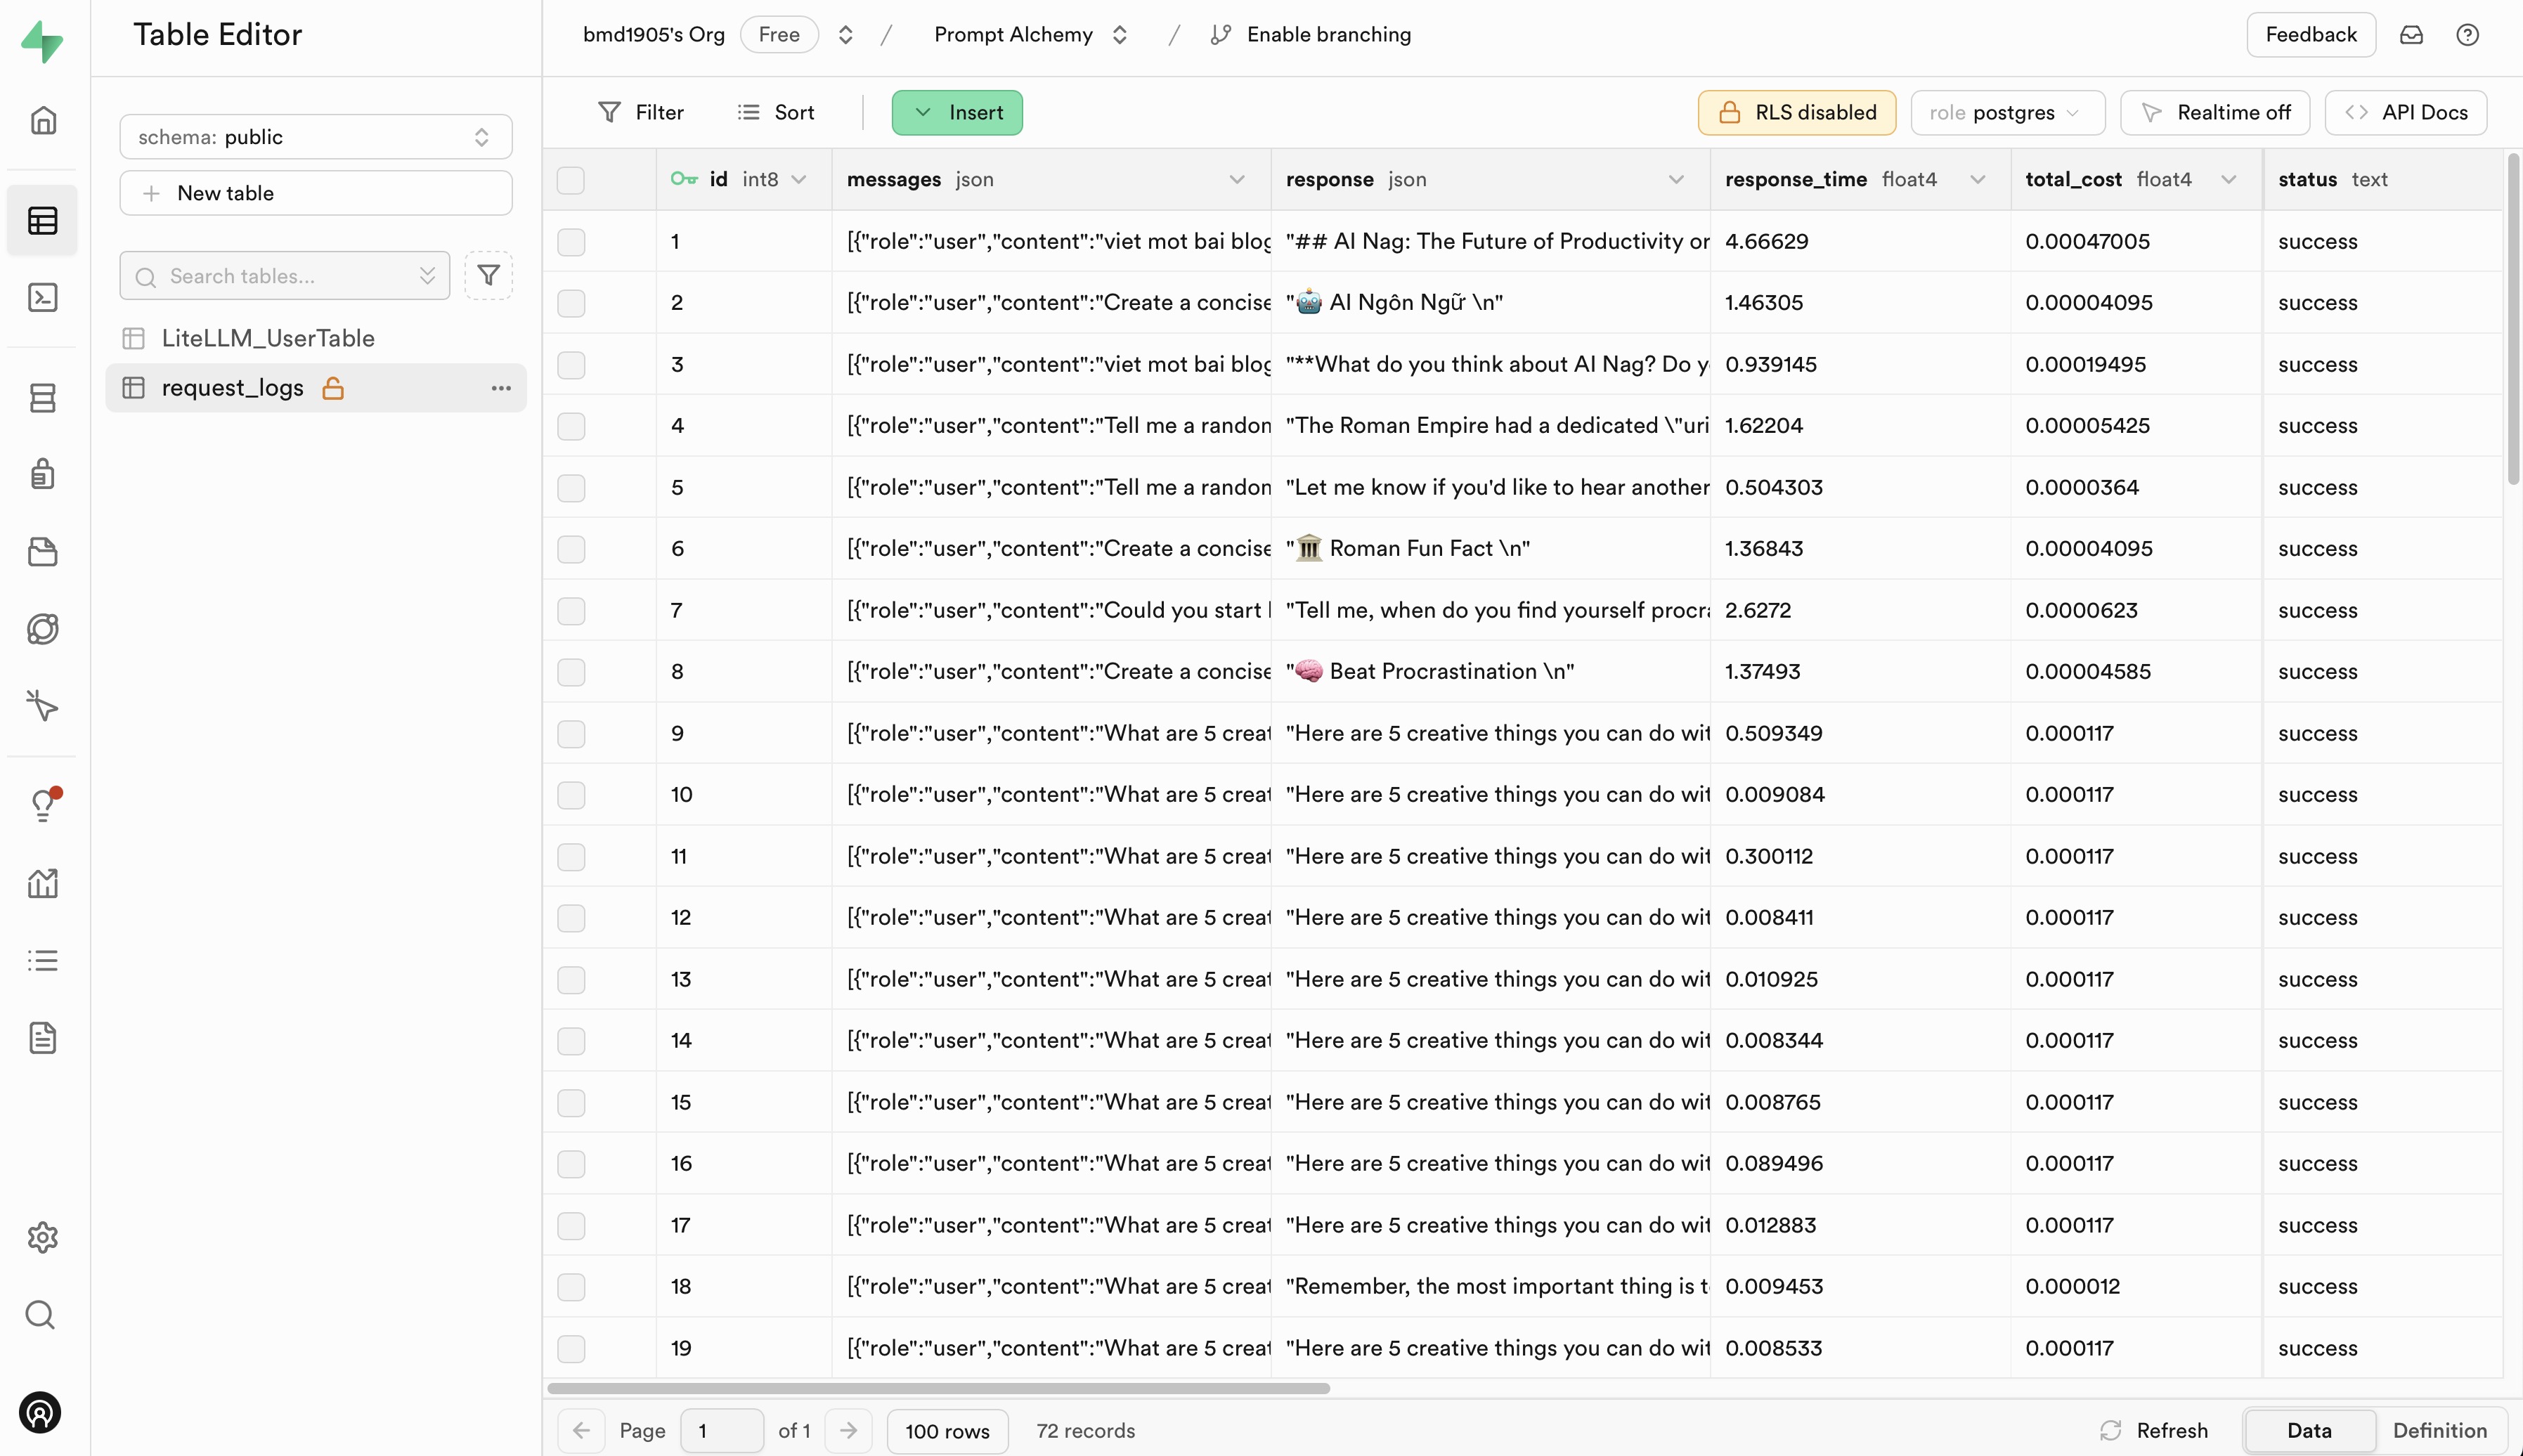
Log Trace with Langfuse and Supabase
- Langfuse is an open source LLM engineering platform - LLM observability, metrics, evaluations, prompt management.
- Supabase is an open source Firebase alternative. Start your project with a Postgres database, Authentication, instant APIs, Edge Functions, Realtime subscriptions, Storage, and Vector embeddings.
Please go to Langfuse and Supabase to sign up for a free account and get API keys, then replace the placehoders in .env.example file with your API keys.
Contributing
We welcome contributions to EasyLLMOps! Please see our CONTRIBUTING.md for more information on how to get started.
License
EasyLLMOps is released under the MIT License. See the LICENSE file for more details.
Citation
If you use EasyLLMOps in your research, please cite it as follows:
@software{EasyLLMOps2024,
  author = {Minh-Duc Bui},
  title = {EasyLLMOps: Effortless MLOps for Powerful Language Models.},
  year = {2024},
  url = {https://github.com/bmd1905/EasyLLMOps}
}
Contact
For questions, issues, or collaborations, please open an issue on our GitHub repository or contact the maintainers directly.

